Power777
No content yet
Power777
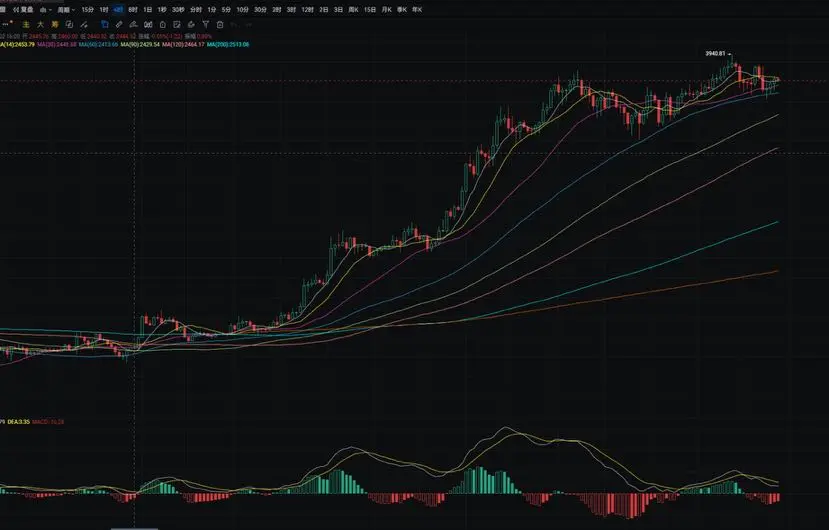
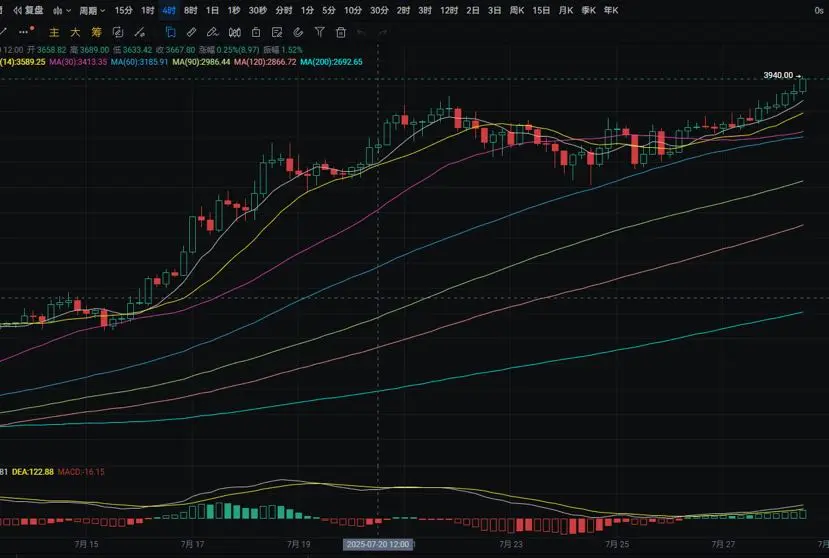
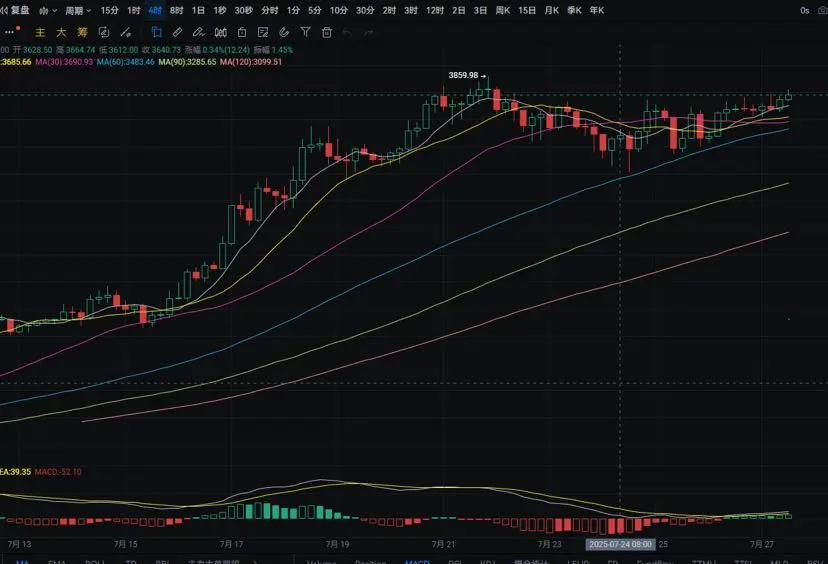
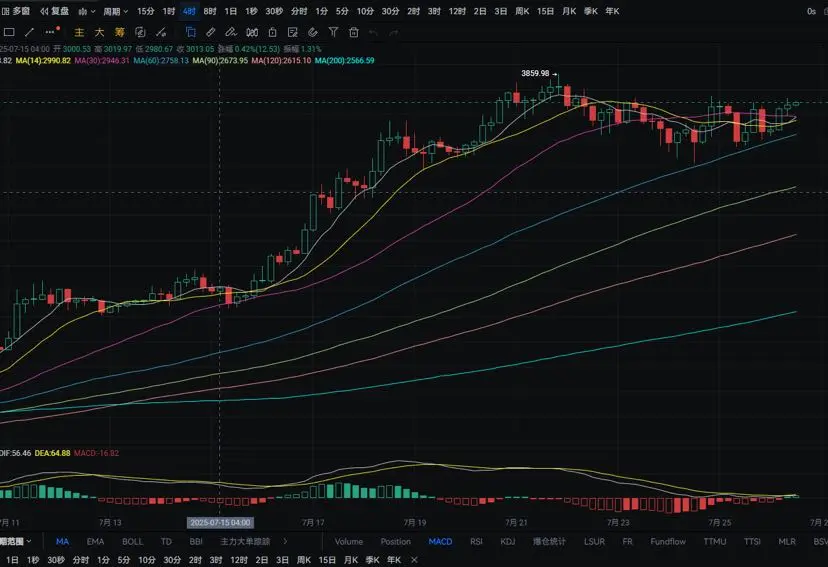
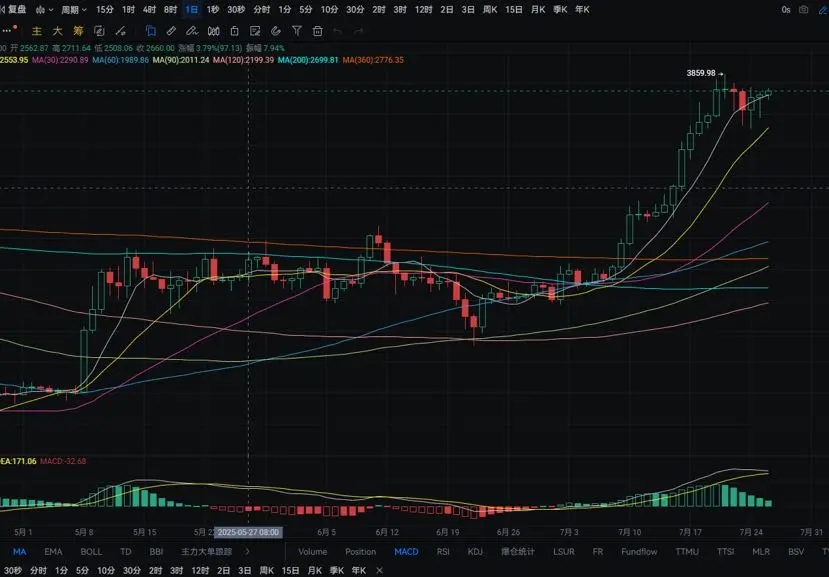
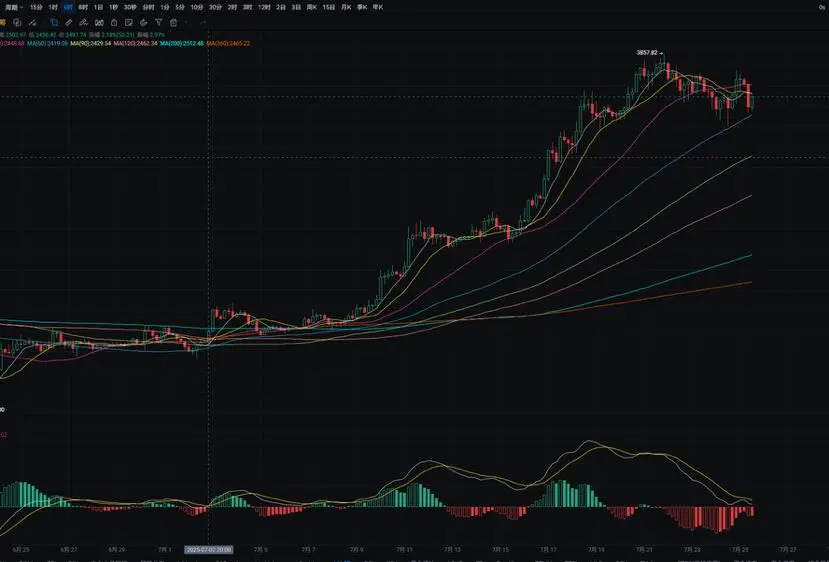
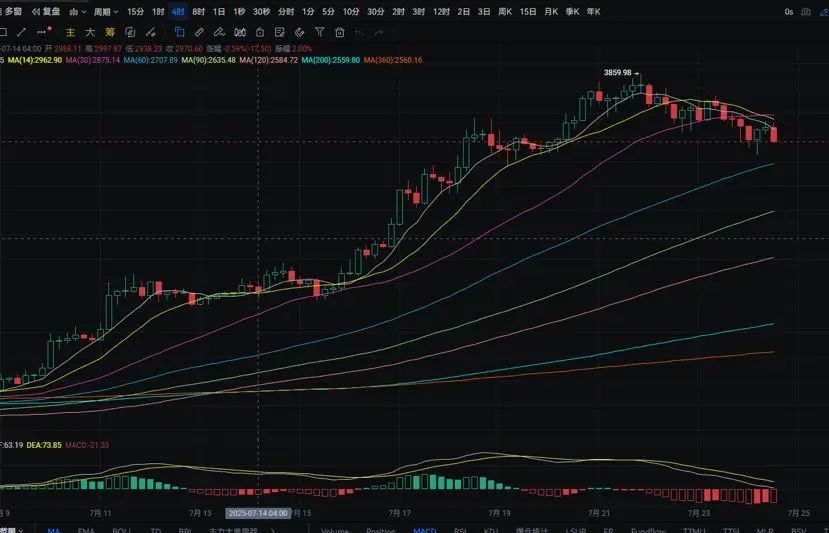
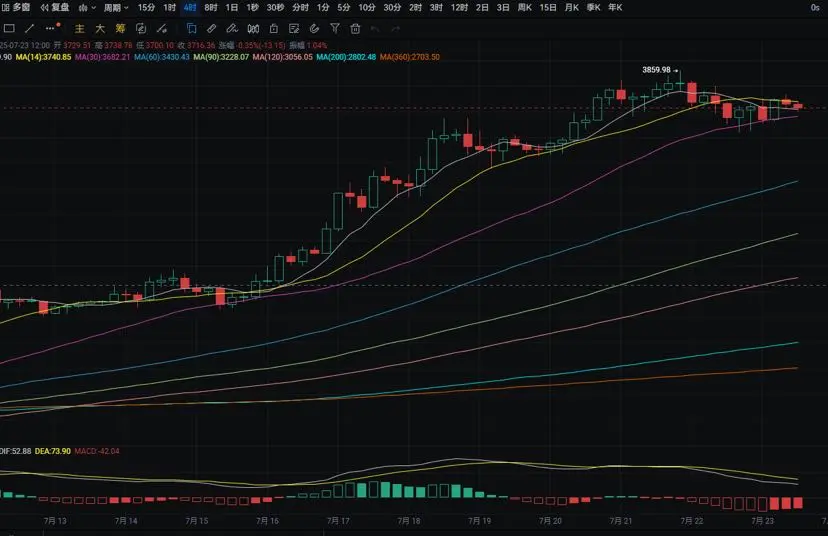
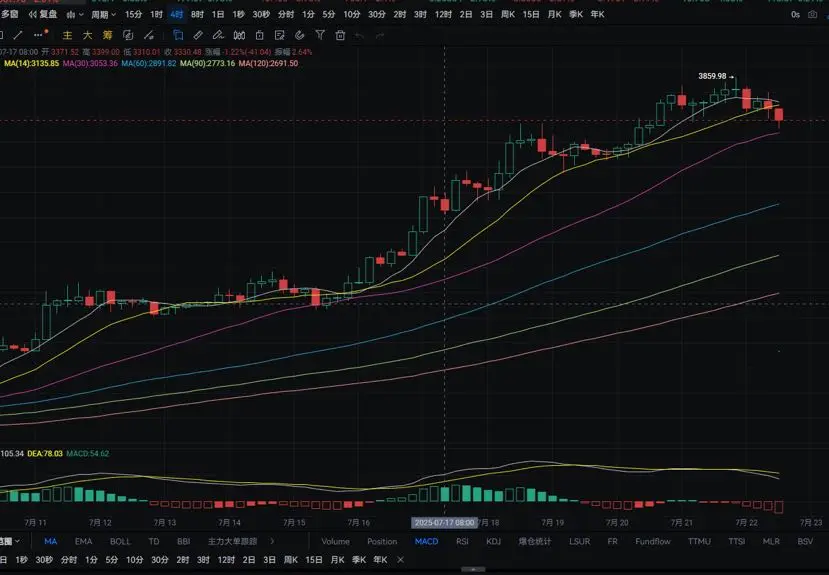
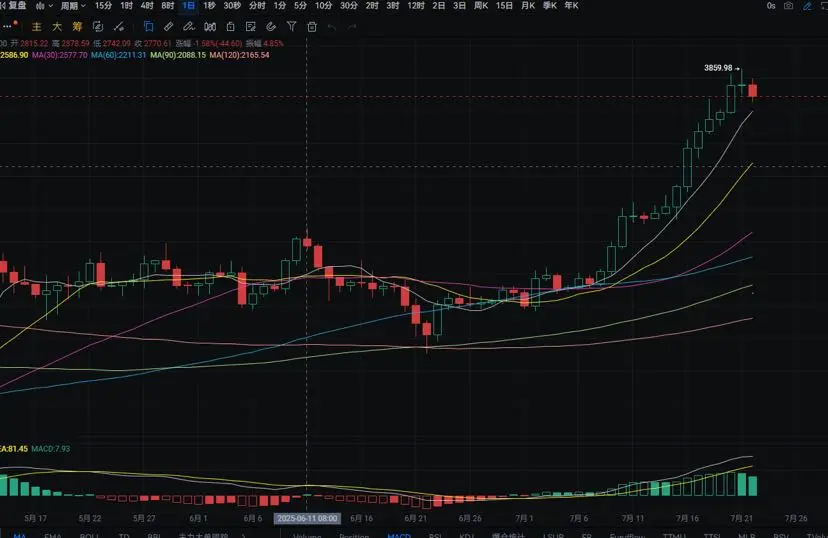
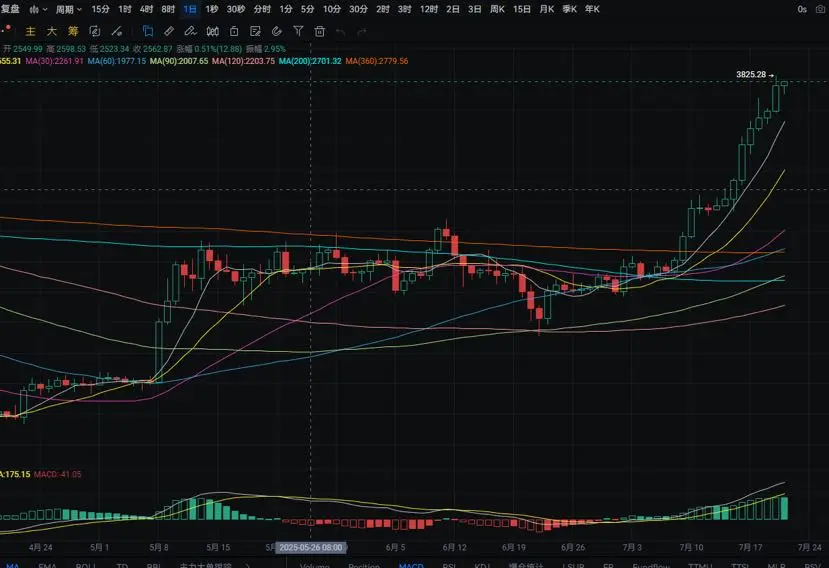
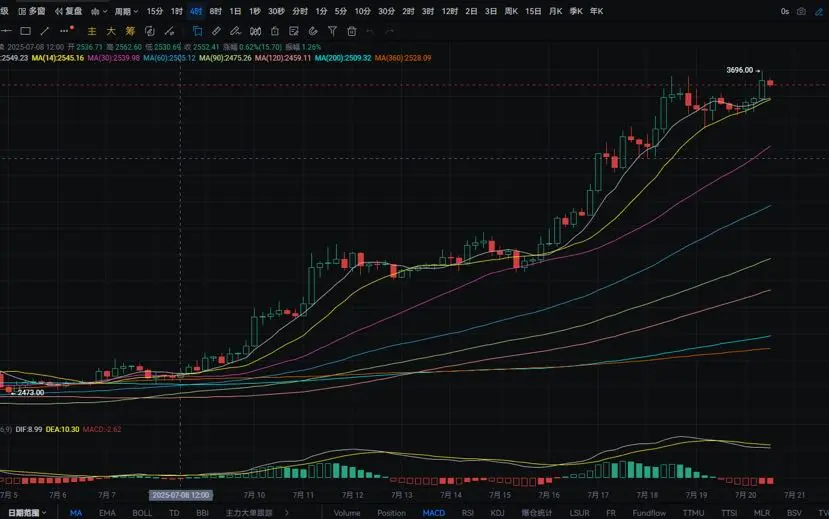
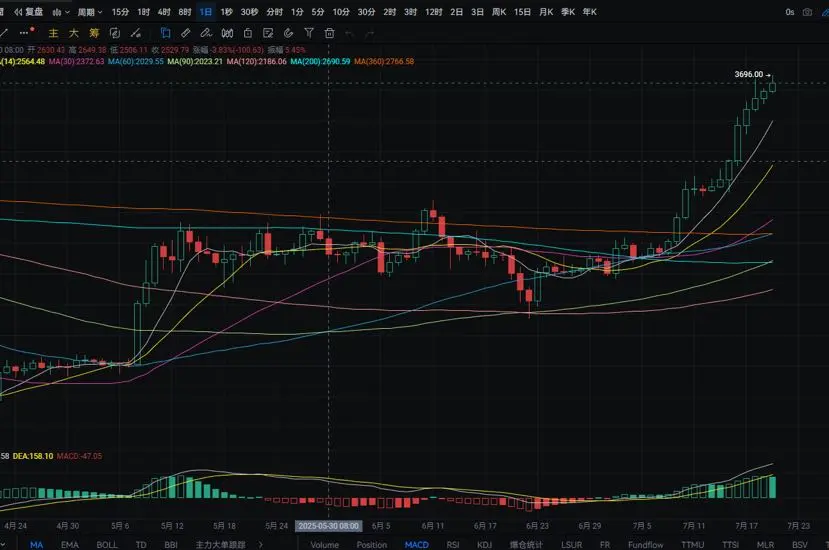
Ether daily chart yesterday fell from a high of around 3885 to a low of around 3710, closing near 3790. The support level is around MA14; if it breaks, we can look for around 3590. A pullback can be used to enter long positions nearby. The resistance level is around 3855; if it breaks, we can look for around 3900. A rebound to nearby can be used to enter short positions. MACD shows a decrease in long positions with signs of a death cross forming. On the four-hour chart, the support level is around MA60; if it breaks, we can look for around MA90. A pullback can be used to enter long positions n
ETH-0.47%
- Reward
- like
- Comment
- Share
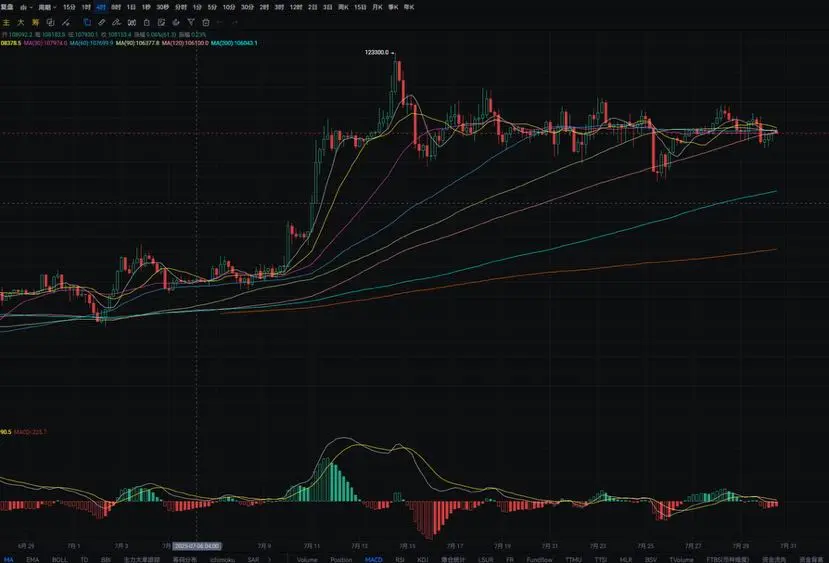
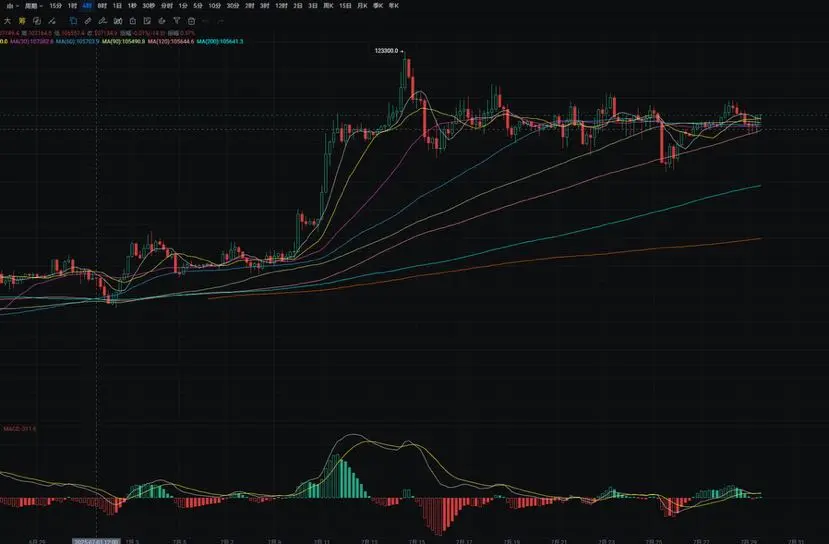
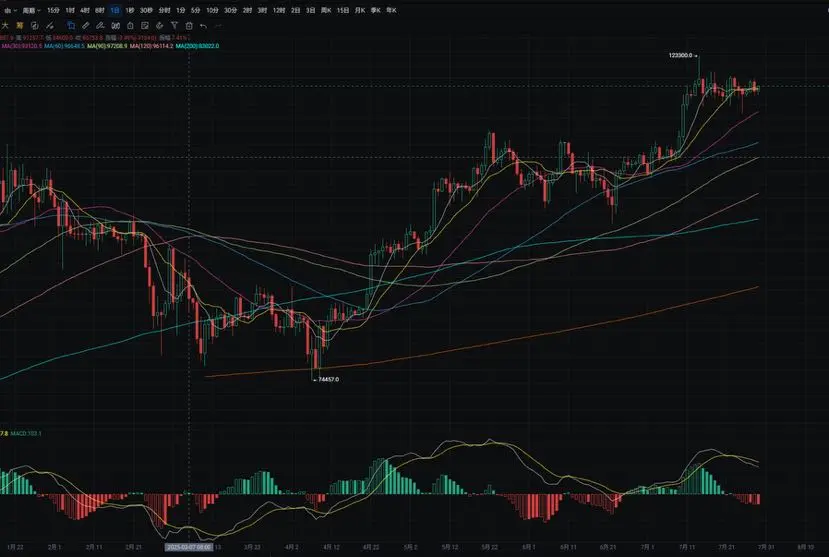
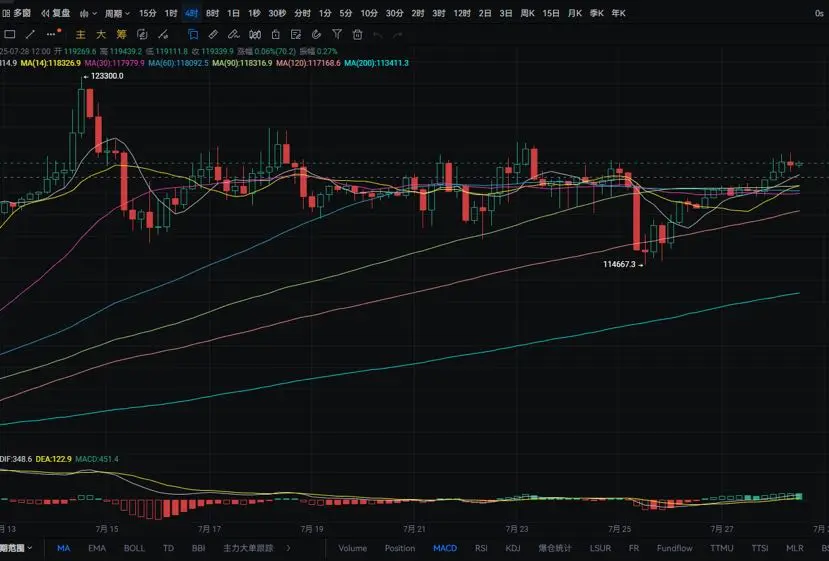
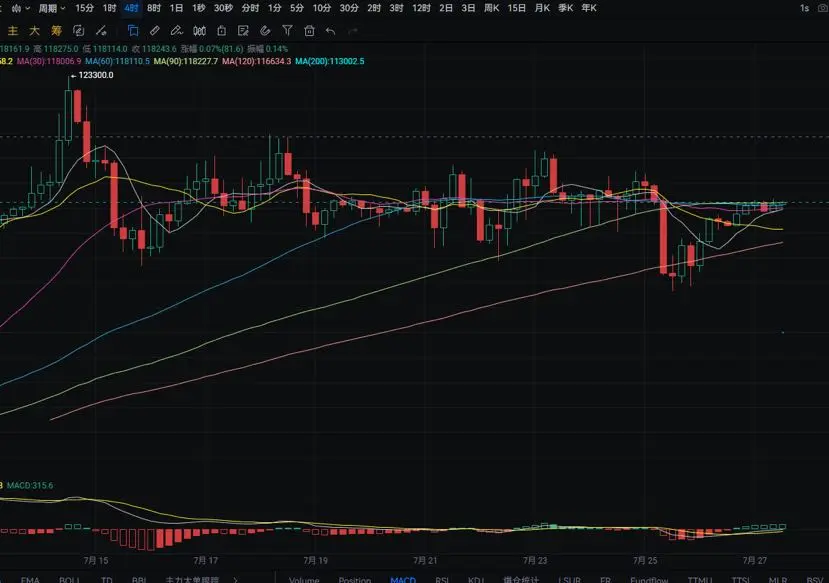
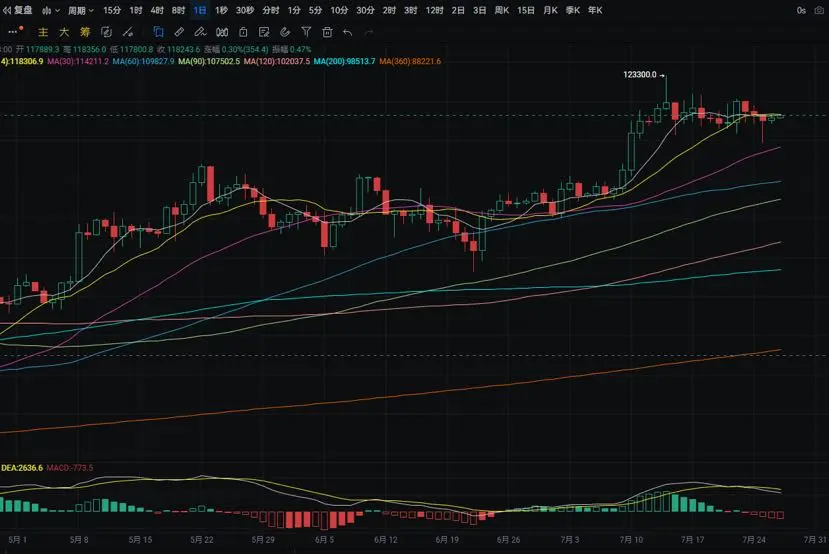
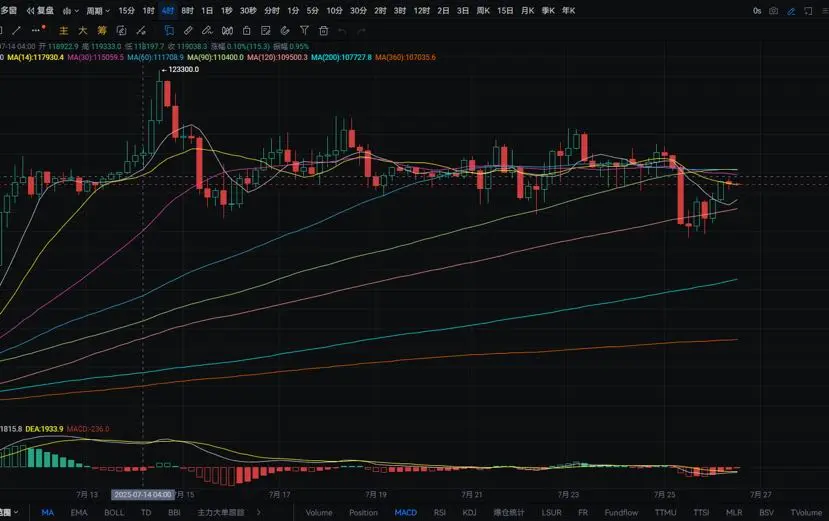
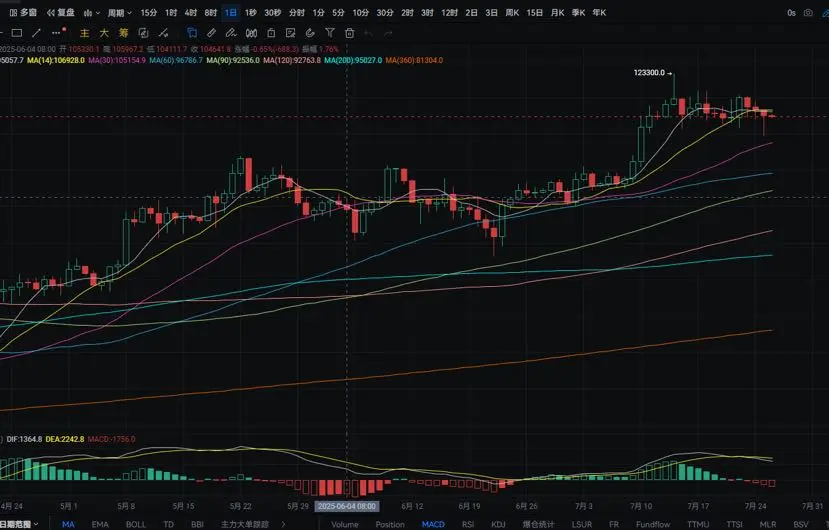
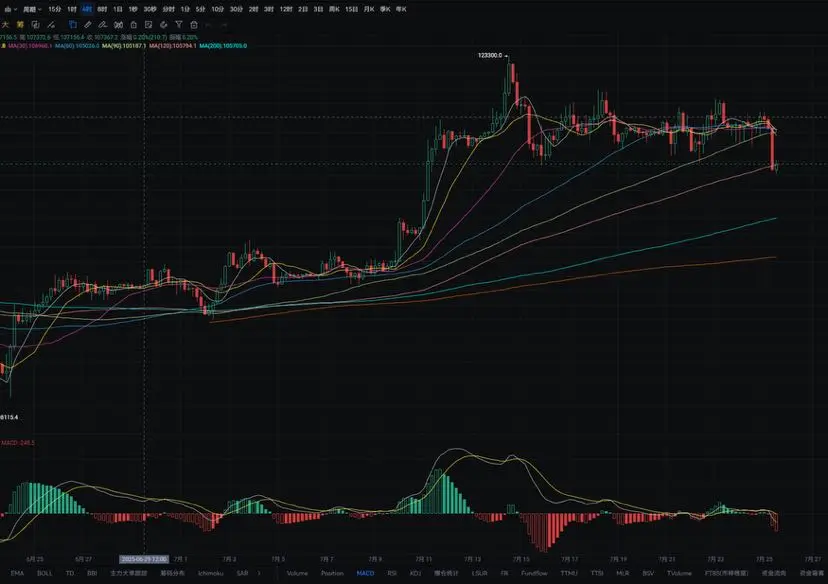
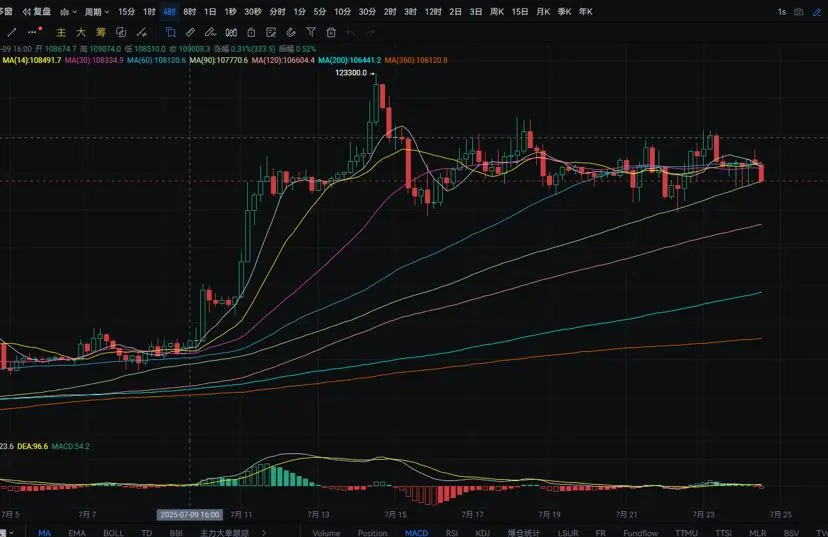
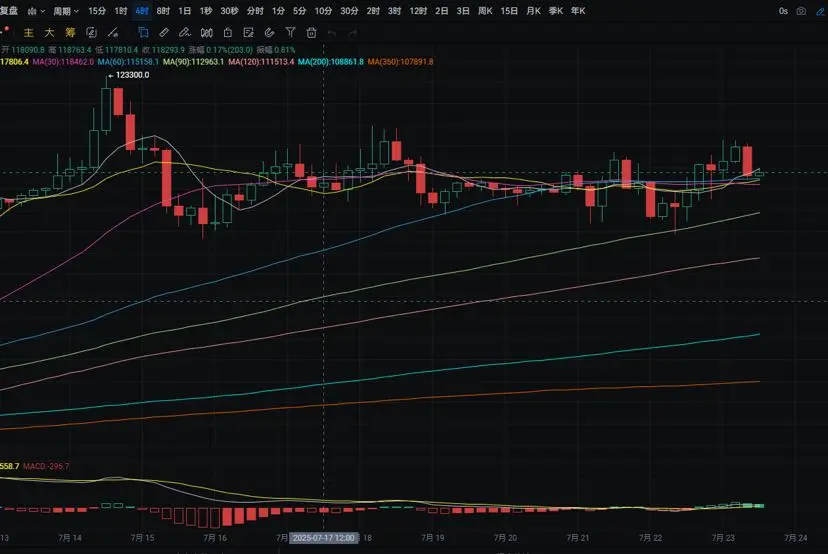
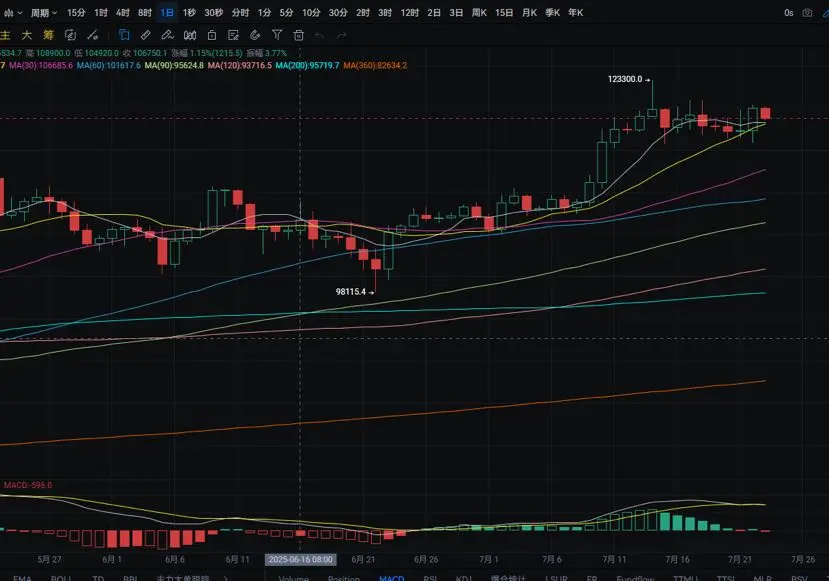
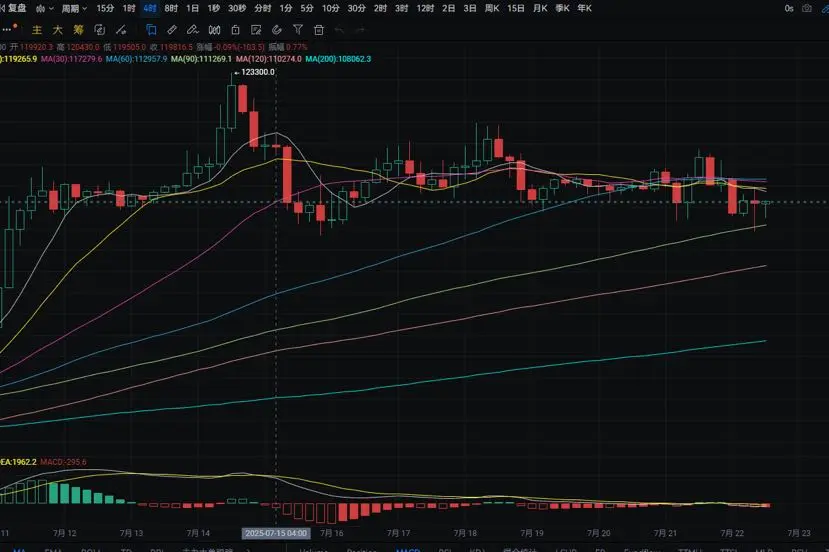
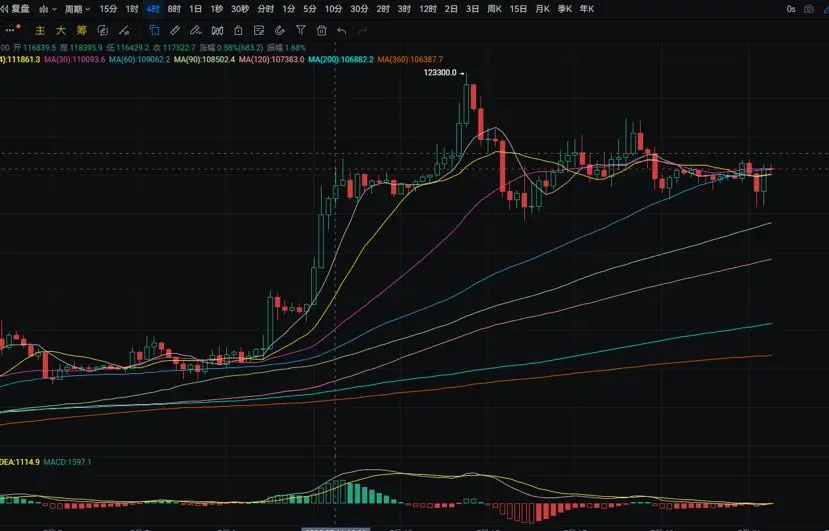
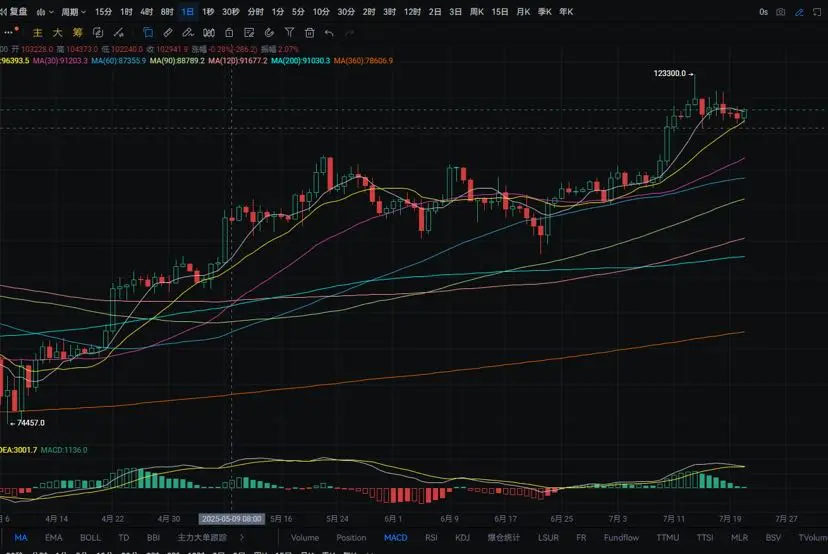
The daily chart for BTC yesterday fell from a high of around 119250 to a low of around 116900, closing below 117900. The support level is around 117400; if it breaks below, we can look to the vicinity of MA30. A pullback can be used to enter long positions nearby. The resistance level is around 119150; if it breaks through, we can look to the vicinity of 120700. A rebound to nearby levels can be used to enter short positions. MACD shows an increase in short positions. On the four-hour chart, the support level is around 117200; if it breaks below, we can look to the vicinity of 116600. A pullba
BTC-0.31%
- Reward
- like
- Comment
- Share
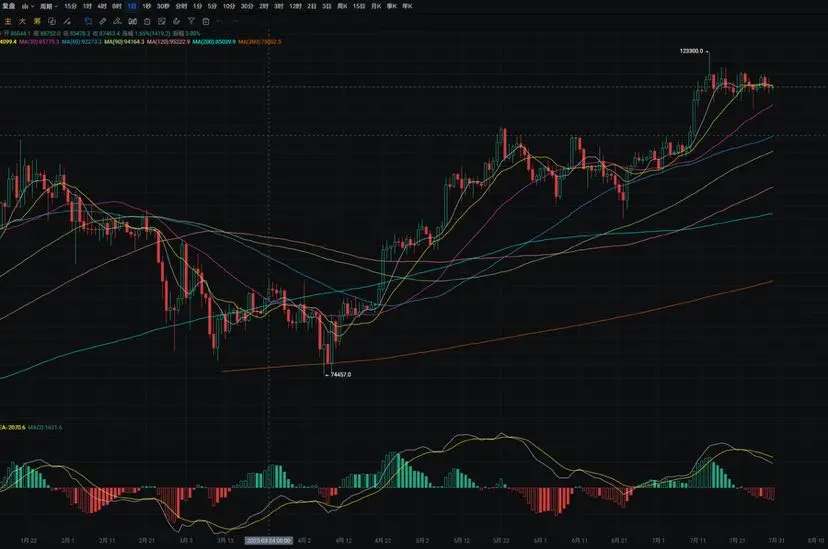
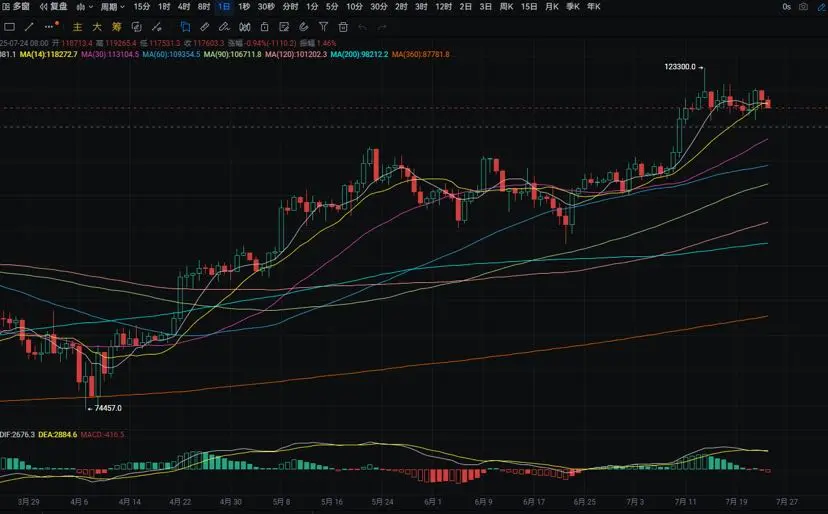
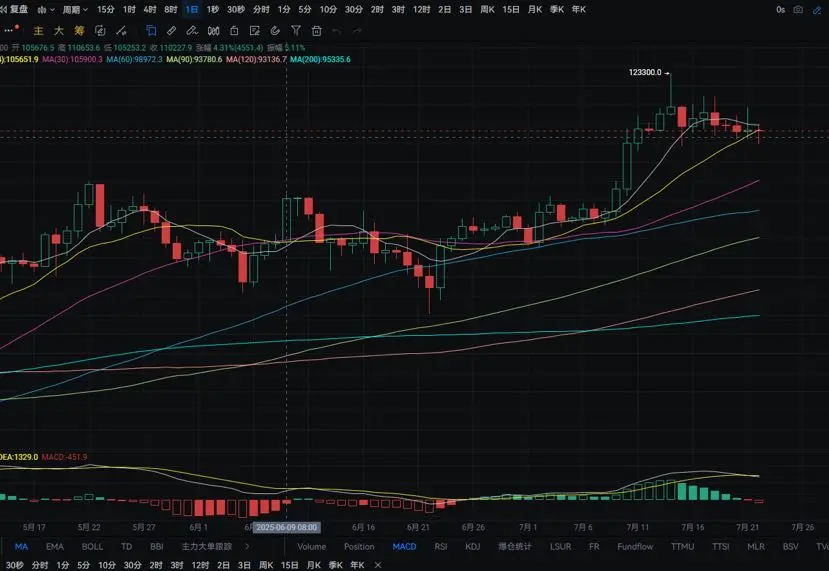
The daily chart of BTC fell from around 119800 yesterday to a low of around 117400, closing at around 118050. The support level is around 117350; if it breaks, we can look for a drop to around MA30. A pullback can be used to enter long positions nearby. The resistance level is around 119800; if it breaks, we can look for a rise to around 121500. A rebound to nearby levels can be used to enter short positions. The MACD shows an increase in short positions. The support level on the four-hour chart is around MA120; if it breaks, we can look for a drop to around 116700. A pullback can be used to e
BTC-0.31%
- Reward
- like
- Comment
- Share
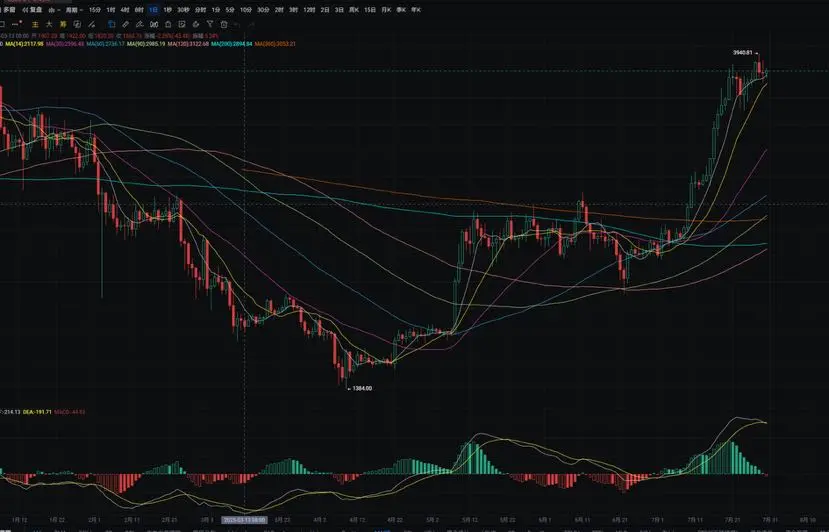
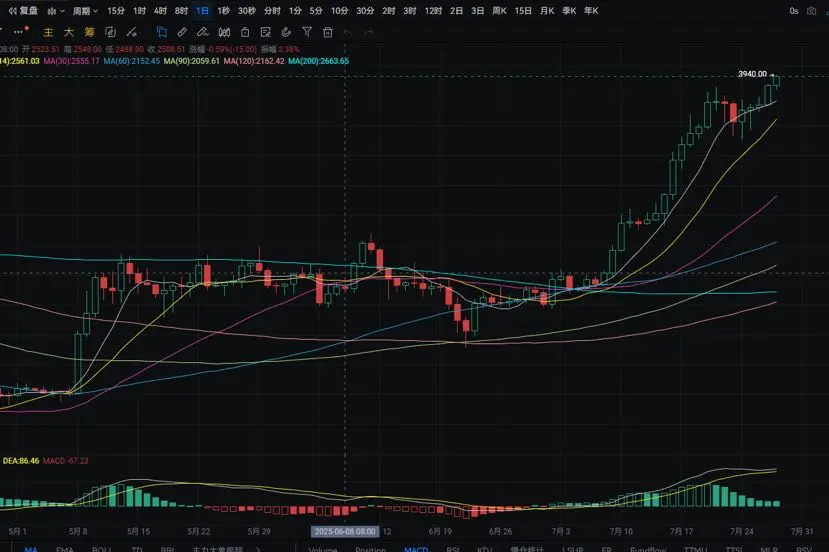
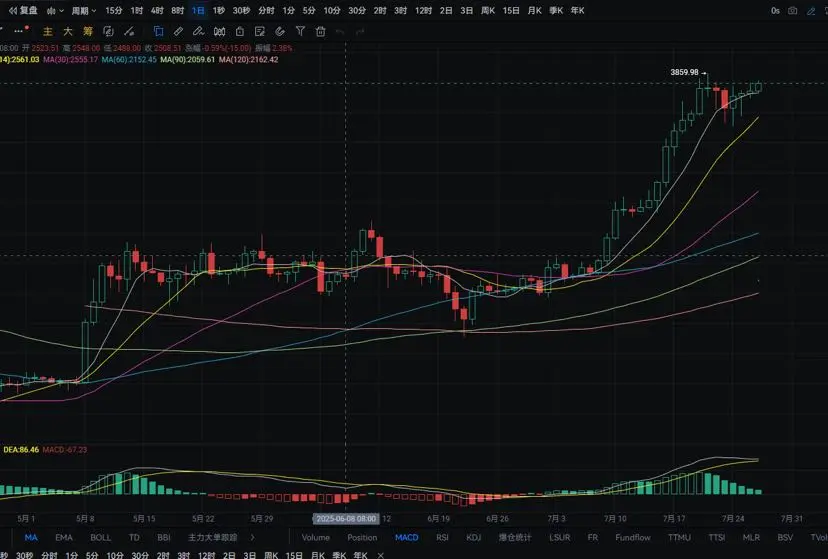
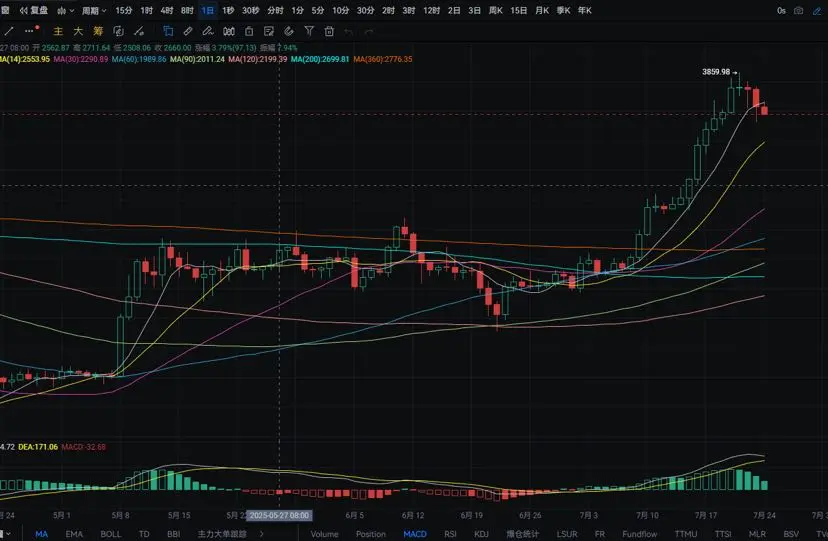
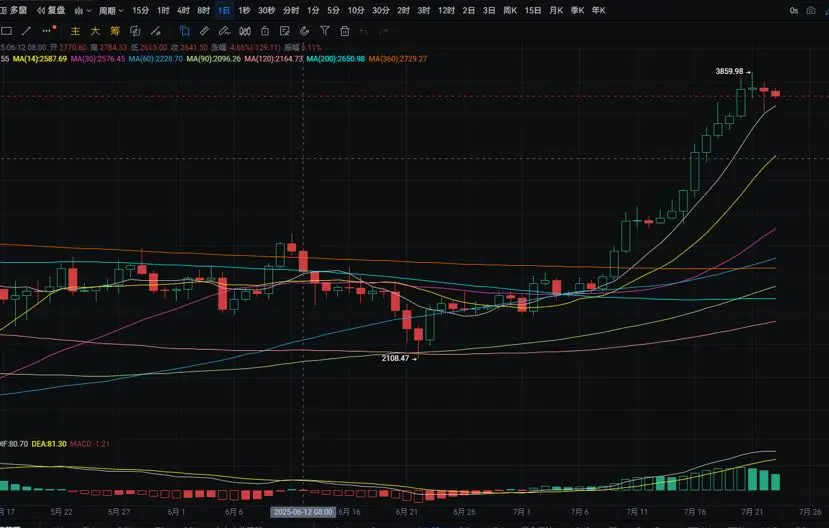
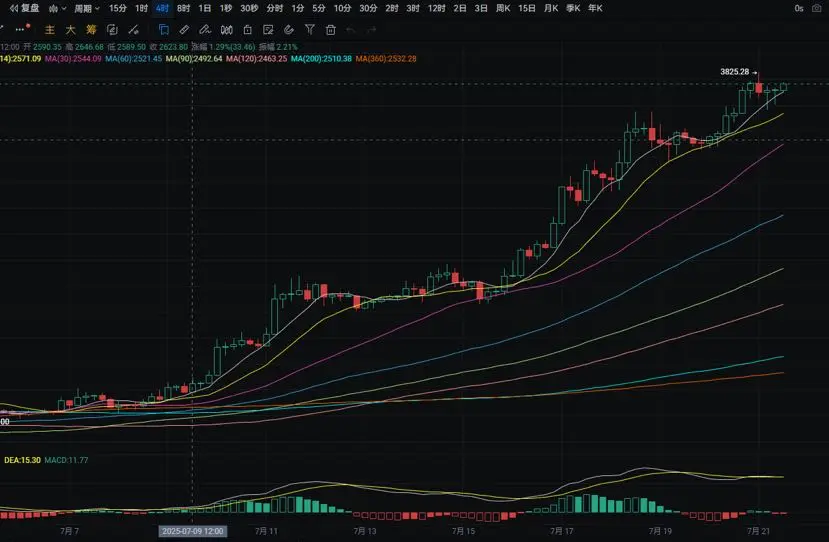
Ether daily chart yesterday rose from a low of around 3730 to a high of around 3880, closing near 3870. The support level is near the MA7 moving average; if broken, it could look down to around MA14. A pullback could be used to enter long positions nearby. The resistance level is around 4000 points. MACD shows a decrease in long positions. The four-hour chart's support level is near 3810; if broken, it could look down to around MA30. A pullback could be used to enter long positions nearby. MACD shows an increase in long positions.
ETH-0.47%
- Reward
- like
- Comment
- Share
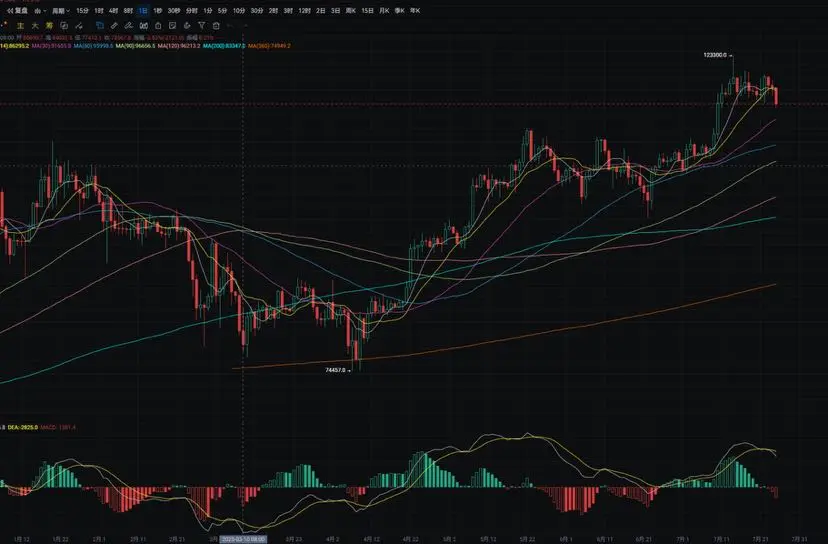
On the daily chart, BTC rose yesterday from the lowest point near 117800 to the highest point near 119750, closing around 119400. The support level is near 117950; if it breaks down, we can look to around 116000. A pullback can be used to enter long positions nearby. The resistance level is around 121000; if it breaks through, we can look to a new high. The MACD shows a decrease in short positions. On the four-hour chart, the support is near MA30; if it breaks down, we can look to MA120. A pullback can be used to enter long positions nearby. The resistance level is around 120700; if it breaks
BTC-0.31%
- Reward
- like
- Comment
- Share
The Ether daily chart rose from a low of around 3695 to a high of around 3795 yesterday, closing near 3740. The support level is around 3625, and if broken, it can be expected to see around MA14. A pullback can provide an opportunity to enter long positions nearby. The resistance level is around 3825, and if broken, it can be expected to reach around 4000 points. A rebound to the nearby area can be an opportunity to enter short positions. The MACD shows a decrease in long positions. The support level on the four-hour chart is near MA30, and if broken, it can be expected to see around 3590. A p
ETH-0.47%
- Reward
- like
- Comment
- Share
The daily chart of BTC rose from a low of around 117100 yesterday to a high of around 118300, closing around 117900. The support level is located around 115900. If it falls below this level, we could see it drop to around MA30. A pullback can be an opportunity to take long positions nearby. The resistance level is around 119100, and if broken, we can look towards 120500. A rebound to nearby levels can provide a chance to take short positions. The MACD shows an increase in short positions. On the four-hour chart, the support level is near MA14. If broken, we could see it drop to around MA120. A
BTC-0.31%
- Reward
- like
- Comment
- Share
The Ether daily chart yesterday rose from a low of around 3570 to a high of around 3750, closing near 3725. The support level is around 3585; if it breaks down, we could see it go down to about 3475. A pullback can be a good opportunity to take long positions near that area. The resistance level is around 3770; if it breaks through, we could look towards 3825. A rebound to that area can be an opportunity to take short positions. MACD shows a reduction in volume for long positions and has signs of forming a death cross. The four-hour support level is near MA60; if it breaks down, we could see i
ETH-0.47%
- Reward
- like
- Comment
- Share
The BTC daily chart yesterday fell from a high of around 118400 to a low of around 114650, closing around 117600. The support level is around 116000; if it breaks down, we can look towards the MA30 area. A rebound can occur nearby for long positions. The resistance level is around the MA14; if it breaks through, we can look towards the area of 120000. If it rebounds to nearby, we can consider short positions. The MACD shows an increase in short positions. The four-hour chart shows support near the MA7 moving average; if it breaks down, we can look towards around 115400. A rebound can occur nea
BTC-0.31%
- Reward
- like
- Comment
- Share
The Ether daily chart yesterday rose from a low of around 3505 to a high of around 3775, closing around 3705. The support level is around 3585; if it breaks down, it could drop to around MA14. A pullback can be used to enter long positions nearby. The resistance level is around 3700; if it breaks through, it could reach around 3800. A rebound nearby can be used to enter short positions. The MACD shows a decrease in long positions, indicating a potential death cross. The four-hour chart shows support at around MA60; if it breaks down, it could drop to around 3475. A pullback can be used to ente
ETH-0.47%
- Reward
- like
- Comment
- Share
The daily chart of BTC yesterday fell from a high of around 119450 to a low of around 117000, closing around 118300. The support level is located around 115950. If it breaks below, we can look towards the MA30. A pullback can be used to enter long positions nearby. The resistance level is at the MA14. If it breaks through, we can look towards around 119150. A rebound to nearby can be used to enter short positions. The MACD shows an increase in short positions, forming a death cross. On the four-hour chart, the support is at around 113700. If it breaks below, we can look towards the MA200. A pu
BTC-0.31%
- Reward
- like
- Comment
- Share
The Ether daily chart yesterday fell from a high of around 3765 to a low of around 3525, closing at around 3630. The support level is around MA14; if it breaks, we can look to around 3140. A rebound can be taken nearby for long positions. The resistance level is around 3710; if it breaks, we can look to around 3800. A rebound to nearby can be taken for short positions. The MACD shows a decrease in long positions, with signs of a death cross forming. The four-hour support level is around 3550; if it breaks, we can look to around 3470. A rebound can be taken nearby for long positions. The resist
ETH-0.47%
- Reward
- like
- Comment
- Share
BTC daily chart yesterday fell from a high of around 120150 to a low of around 117250, closing around 118700. The support level is around 117300; if it breaks, it can be seen near MA30. A rebound can be taken near this level. The resistance level is around 119150; if it breaks, it can be seen near 121500. A rebound to this level can be taken for short positions. MACD short positions are increasing, forming a death cross. The four-hour support level is near MA90; if it breaks, it can be seen near MA120. A rebound can be taken near this level. The resistance level is around 118700; if it breaks,
BTC-0.31%
- Reward
- like
- Comment
- Share
The Ether daily chart fell from around 3800 yesterday to a low of around 3620, closing near 3745. The support level is around the MA7 moving average; if it breaks down, it could be seen near the MA14. A bounce back can be looked for near this level to enter long positions. The resistance level is around 3765; if it breaks through, it could be seen near 3845. A rebound to this area can be used to enter short positions. The MACD shows a decrease in long positions. The four-hour chart shows support near the MA30; if it breaks down, it could be seen near 3595. A bounce back can be looked for near
ETH-0.47%
- Reward
- like
- Comment
- Share
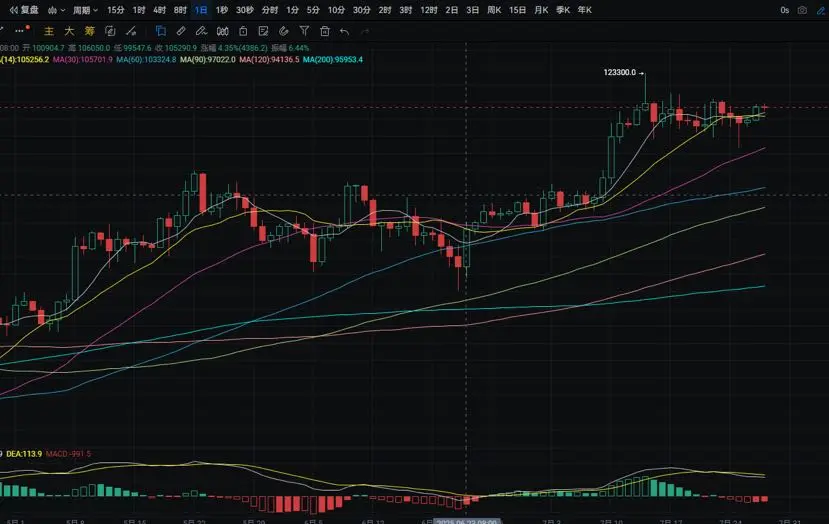
The BTC daily chart rose from a low of around 115850 yesterday to a high of around 120150, closing near 120000. The support level is around 117250; if it breaks below, we could see it drop to near MA30. A pullback can be an opportunity to buy near this level. The resistance level is around 121000; if it breaks above, we could see new highs. The MACD is fluctuating and flat, with the two lines converging. On the four-hour chart, the support level is around 117900; if it breaks below, we could see it drop to near MA90. A pullback can be an opportunity to buy near this level. The resistance level
BTC-0.31%
- Reward
- 3
- Comment
- Share
The Ether daily chart rose from a low of around 3700 to a high of around 3860 yesterday, closing near 3765. The support level is near the MA7 moving average; if it breaks, we could see it drop to around 3475. A pullback can be used to enter long positions nearby. The resistance level is around 3760; if it breaks through, we could see it rise to around 3890. A rebound to nearby can be used to enter short positions. The MACD shows a decrease in long positions. On the four-hour chart, the support is near the MA30; if it breaks, we could see it drop to around 3540. A pullback can be used to enter
ETH-0.47%
- Reward
- like
- Comment
- Share
The BTC daily chart rose from around 116450 yesterday to a high of around 119700, closing at around 117350. The support level is around 116000. If it breaks down, it could go to around MA30. A pullback can be used to enter long positions nearby. The resistance level is around 119000; if it breaks through, it could go to around 121000. A rebound can be used to enter short positions nearby. The MACD shows an increase in short positions. On the four-hour chart, the support is around MA90; if it breaks down, it could go to around MA120. A pullback can be used to enter long positions nearby. The re
BTC-0.31%
- Reward
- 3
- 1
- Share
CryptoRoyal :
:
Bull Run 🐂Ether daily chart yesterday rose from a low of around 3580 to a high of around 3825, closing at around 3755. The support level below is around 3590; if it breaks, we may see around 3370. A pullback can be taken to enter long positions nearby. The resistance level above is around 3875; if it breaks, we may see around 4000 points. MACD long positions are increasing. The four-hour support level below is around MA14; if it breaks, we may see around MA30. A pullback can be taken to enter long positions nearby. MACD is stabilizing and the two lines are converging.
ETH-0.47%
- Reward
- like
- 2
- Share
Okeystan:
1000x Vibes 🤑View More
The daily chart of BTC fell from a high of around 118850 yesterday to a low of around 116350, closing around 117200. The support level is around 116000; if it breaks, it could drop to near MA30. A pullback can be an opportunity to enter long positions nearby. The resistance level is around 119150; if it breaks, it could rise to around 120900. A rebound to nearby levels can be an opportunity to enter short positions. The MACD shows a decrease in long positions and has signs of forming a death cross. On the four-hour chart, the support level is around 116800; if it breaks, it could drop to near
BTC-0.31%
- Reward
- like
- Comment
- Share
The Ether daily chart yesterday rose from a low of around 3505 to a high of around 3610, closing at around 3590. The support level is around 3545; if it breaks, we can look towards the MA7 moving average. A pullback can be used to enter long positions nearby. The resistance level is around 3715; if it breaks, we can look towards 3775. A rebound to nearby levels can be used to enter short positions. MACD indicates increasing long positions. On the four-hour chart, the support level is near the MA14; if it breaks, we can look towards the MA30. A pullback can be used to enter long positions nearb
ETH-0.47%
- Reward
- like
- Comment
- Share