

- Topic
10k Popularity
184k Popularity
9k Popularity
15k Popularity
955 Popularity
- Pin
- Gate July 2025 Transparency Report:
Accelerating Leadership in the Global Crypto Landscape!
#GateTransparencyReport# - 📢 Gate Square Exclusive: #PUBLIC Creative Contest# Is Now Live!
Join Gate Launchpool Round 297 — PublicAI (PUBLIC) and share your post on Gate Square for a chance to win from a 4,000 $PUBLIC prize pool
🎨 Event Period
Aug 18, 2025, 10:00 – Aug 22, 2025, 16:00 (UTC)
📌 How to Participate
Post original content on Gate Square related to PublicAI (PUBLIC) or the ongoing Launchpool event
Content must be at least 100 words (analysis, tutorials, creative graphics, reviews, etc.)
Add hashtag: #PUBLIC Creative Contest#
Include screenshots of your Launchpool participation (e.g., staking record, reward - 🎉 Hey Gate Square friends! Non-stop perks and endless excitement—our hottest posting reward events are ongoing now! The more you post, the more you win. Don’t miss your exclusive goodies! 🚀
🆘 #Gate 2025 Semi-Year Community Gala# | Square Content Creator TOP 10
Only 1 day left! Your favorite creator is one vote away from TOP 10. Interact on Square to earn Votes—boost them and enter the prize draw. Prizes: iPhone 16 Pro Max, Golden Bull sculpture, Futures Vouchers!
Details 👉 https://www.gate.com/activities/community-vote
1️⃣ #Show My Alpha Points# | Share your Alpha points & gains
Post your
The alarm bells are ringing for XLM, which has increased 6 times in three weeks.
Stellar (XLM) has attracted attention by rising over 600% in the last three weeks.
The resignation of SEC Chairman Gary Gensler on January 20th has triggered a bull run in XRP. XRP, which has risen to $1.6, has also paved the way for many altcoins.
XLM, known as the rival of XRP, made a striking rally in November, also influenced by positive market conditions. XLM has gained 6 times its value in the last three weeks.
AMBCrypto predicts that XLM may face a potential correction. The chart analysis highlights two important support levels.
Stellar (XLM) chart analysis
According to AMBCrypto's analysis, XLM price is giving a bearish signal.
AMBCrypto, which says "XLM may be entering a retracement phase", stated that the altcoin with a market value of 15 billion is facing pressure from long liquidations. According to the analysis, a cluster of liquidations formed in the range of $0.46 to $0.473.
Analysis predicts that long liquidations need to be cleared and XLM price could drop to $0.46. If there is no buying pressure at these levels, the price is expected to fall to $0.363.
According to the chart analysis, there may be potential support levels at $0.4283 and $0.363. These areas have been marked as regions that XLM needs to hold in order to maintain its upward trend.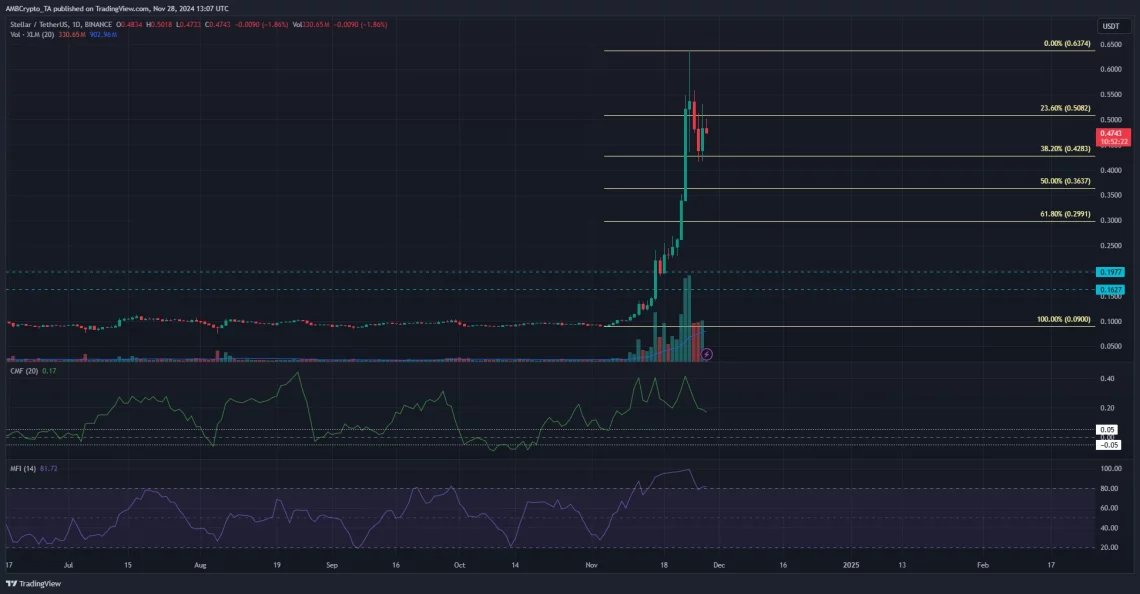
If XLM continues to rise, it will test $0.766. If this resistance is overcome, the price could reach $0.8756, the all-time high. The Fibonacci indicator identifies the $0.766 region and the $0.975 level as the next upward targets.
This article does not contain investment advice or recommendation. Every investment and trading transaction involves risk, and readers should conduct their own research when making decisions.