

- Topic
9k Popularity
8k Popularity
164k Popularity
22k Popularity
20k Popularity
- Pin
- Gate July 2025 Transparency Report:
Accelerating Leadership in the Global Crypto Landscape!
#GateTransparencyReport# - 📢 Gate Square Exclusive: #PUBLIC Creative Contest# Is Now Live!
Join Gate Launchpool Round 297 — PublicAI (PUBLIC) and share your post on Gate Square for a chance to win from a 4,000 $PUBLIC prize pool
🎨 Event Period
Aug 18, 2025, 10:00 – Aug 22, 2025, 16:00 (UTC)
📌 How to Participate
Post original content on Gate Square related to PublicAI (PUBLIC) or the ongoing Launchpool event
Content must be at least 100 words (analysis, tutorials, creative graphics, reviews, etc.)
Add hashtag: #PUBLIC Creative Contest#
Include screenshots of your Launchpool participation (e.g., staking record, reward - 🎉 Hey Gate Square friends! Non-stop perks and endless excitement—our hottest posting reward events are ongoing now! The more you post, the more you win. Don’t miss your exclusive goodies! 🚀
🆘 #Gate 2025 Semi-Year Community Gala# | Square Content Creator TOP 10
Only 1 day left! Your favorite creator is one vote away from TOP 10. Interact on Square to earn Votes—boost them and enter the prize draw. Prizes: iPhone 16 Pro Max, Golden Bull sculpture, Futures Vouchers!
Details 👉 https://www.gate.com/activities/community-vote
1️⃣ #Show My Alpha Points# | Share your Alpha points & gains
Post your - 💙 Gate Square #Gate Blue Challenge# 💙
Show your limitless creativity with Gate Blue!
📅 Event Period
August 11 – 20, 2025
🎯 How to Participate
1. Post your original creation (image / video / hand-drawn art / digital work, etc.) on Gate Square, incorporating Gate’s brand blue or the Gate logo.
2. Include the hashtag #Gate Blue Challenge# in your post title or content.
3. Add a short blessing or message for Gate in your content (e.g., “Wishing Gate Exchange continued success — may the blue shine forever!”).
4. Submissions must be original and comply with community guidelines. Plagiarism or re
[Japanese Stocks] Reasons Why the Nikkei Average Has Updated Its All-Time High | Hiroyuki Fukunaga's Technical Analysis Course You Can Ask Now | Moneyクリ MoneyX Securities Investment Information and Media Useful for Money
Nikkei Average Updates to All-Time High
On August 12, after the three-day holiday, the Tokyo market rose significantly, and following last weekend's TOPIX, the Nikkei Stock Average also ended trading at a record high. One of the factors that pushed up the stock prices was a temporary easing of concerns over the US-China tariff negotiations, but there are also technical reasons cited.
It is the occurrence of a window. I have explained windows in detail in this series before, do you remember?
Types of Windows and Reasons for Price Increases
Now, let's review the types of windows. There are four types of windows: common gap, runaway gap, breakaway gap, and exhaustion gap.
Among these four, the window that occurred this time is the breakout window (breakaway gap). As for the actual stock prices, after reaching a high on July 24, on August 8, just before the three-day weekend, it ended without reaching the high of July 24. There were concerns that if it started to decline after the three-day weekend, it might form a double top, but when trading began, it opened with a gap above the high reached on July 24. This gap can be considered a window that starts above the recent high (i.e., breaks out) and is a breakout window (breakaway gap).
When a breakout gap occurs, it is mostly the case that the upward movement continues to expand thereafter. This time, it is believed that the price movements also expanded, and the high reached on July 11, 2024, was quickly updated.
[Chart] Nikkei Average Stock Price (Daily)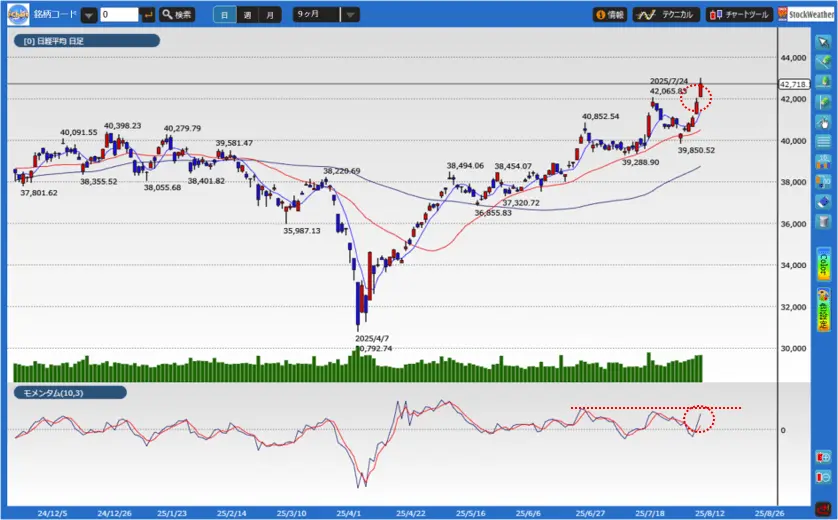 Source: Created by Invest Trust Co., Ltd. from i-chart
The moving average periods are set to 5 days (blue line), 25 days (red line), and 75 days (gray line).
*Volume is in the Prime Market
*The momentum period is set to 10 days (blue line), and the 3-day moving average of the momentum (red line) is also displayed.
Source: Created by Invest Trust Co., Ltd. from i-chart
The moving average periods are set to 5 days (blue line), 25 days (red line), and 75 days (gray line).
*Volume is in the Prime Market
*The momentum period is set to 10 days (blue line), and the 3-day moving average of the momentum (red line) is also displayed.
Should we be wary of short-term overheating?
However, the divergence from the 5-day and 25-day moving averages is also widening, and it may be necessary to be cautious of short-term overheating. Generally, based on past experience, when the divergence from the 25-day moving average reaches 5% to 10%, it is often considered that stock prices are likely to hit a peak.
The divergence rate between the 25-day moving average and the stock price on August 12 is 5.47% based on the closing price, which indicates that it is in a caution zone. However, since it is difficult to pinpoint the timing for buying and selling, it is also possible that the stock price level may rise sharply. Therefore, if the upward trend continues, it is necessary to consider the timing for buying and selling with the possibility of approaching or exceeding 10%.
On the other hand, if the increase levels off around 10%, caution is needed for a potential decline. Attention should be paid to the divergence between the stock price level during trading hours and the 25-day moving average.
The surge in momentum continues, watch for indications of sustained momentum.
In this context, looking at the momentum that indicates the strength of both upward and downward movements, both the momentum and its moving average line, known as the signal, are rising sharply. Additionally, it has surpassed the 0 line, which serves as the dividing line for determining the strength of upward and downward momentum.
In this situation, the focus is on whether the upward trend of the two lines will continue. If the upward trend persists, it is conceivable that the divergence rate could expand to nearly 10%, and it is necessary to pay attention to the level of momentum to determine if the strength of the upward momentum will continue.
On the other hand, if the price surpasses the recent high level (June 24) but then immediately falls below it, or if the stock price is reaching new highs while the momentum levels fail to exceed the recent high level (June 24), a reversal phenomenon will occur. As a sharp decline also comes into focus, it is important to pay attention to whether the momentum continues to rise in conjunction with the increase in stock prices, which can help in making trading decisions.