

- Topic
9k Popularity
8k Popularity
164k Popularity
22k Popularity
20k Popularity
- Pin
- Gate July 2025 Transparency Report:
Accelerating Leadership in the Global Crypto Landscape!
#GateTransparencyReport# - 📢 Gate Square Exclusive: #PUBLIC Creative Contest# Is Now Live!
Join Gate Launchpool Round 297 — PublicAI (PUBLIC) and share your post on Gate Square for a chance to win from a 4,000 $PUBLIC prize pool
🎨 Event Period
Aug 18, 2025, 10:00 – Aug 22, 2025, 16:00 (UTC)
📌 How to Participate
Post original content on Gate Square related to PublicAI (PUBLIC) or the ongoing Launchpool event
Content must be at least 100 words (analysis, tutorials, creative graphics, reviews, etc.)
Add hashtag: #PUBLIC Creative Contest#
Include screenshots of your Launchpool participation (e.g., staking record, reward - 🎉 Hey Gate Square friends! Non-stop perks and endless excitement—our hottest posting reward events are ongoing now! The more you post, the more you win. Don’t miss your exclusive goodies! 🚀
🆘 #Gate 2025 Semi-Year Community Gala# | Square Content Creator TOP 10
Only 1 day left! Your favorite creator is one vote away from TOP 10. Interact on Square to earn Votes—boost them and enter the prize draw. Prizes: iPhone 16 Pro Max, Golden Bull sculpture, Futures Vouchers!
Details 👉 https://www.gate.com/activities/community-vote
1️⃣ #Show My Alpha Points# | Share your Alpha points & gains
Post your - 💙 Gate Square #Gate Blue Challenge# 💙
Show your limitless creativity with Gate Blue!
📅 Event Period
August 11 – 20, 2025
🎯 How to Participate
1. Post your original creation (image / video / hand-drawn art / digital work, etc.) on Gate Square, incorporating Gate’s brand blue or the Gate logo.
2. Include the hashtag #Gate Blue Challenge# in your post title or content.
3. Add a short blessing or message for Gate in your content (e.g., “Wishing Gate Exchange continued success — may the blue shine forever!”).
4. Submissions must be original and comply with community guidelines. Plagiarism or re
[Forex] Predicting USD/JPY from 8/12 to 8/15 | Yoshida Tsune's Forex Weekly | Moneyクリ MoneyX Securities' investment information and media useful for money.
Review of Last Week (Week of August 4) = The "Employment Statistics Shock" Has Eased the Plummet of the Dollar
The plummeted Japan-US interest rate differential slightly widened last week.
Last week, the USD/JPY pair fluctuated around the 147 yen level. Following the approximately 3 yen plummet triggered by the U.S. employment data release at the end of the week of July 28, there were moments where it continued to fall to the 146 yen level, but it did not reach further declines (see Chart 1).
[Figure 1] Daily chart of USD/JPY (June 2025 onwards)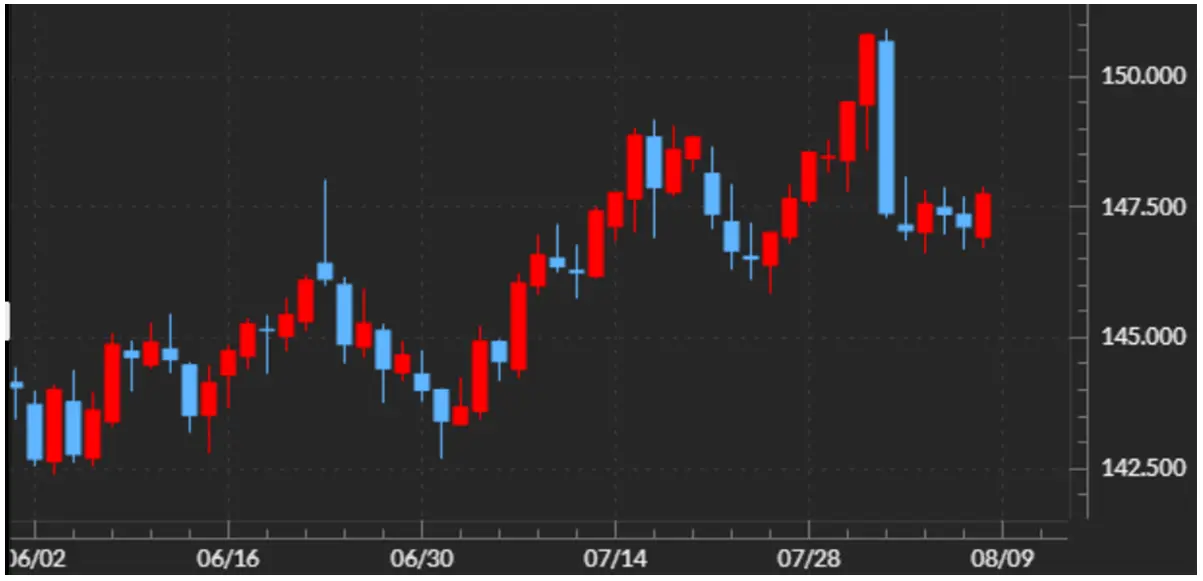 Source: Manex Trader FX
The plummet of the Dollar/Yen triggered by the release of the US employment statistics was referred to as the "employment statistics shock." Last week (week of August 4), this subsided slightly because the day-to-day interest rate difference between the US and Japan, which had sharply contracted due to the "employment statistics shock" (Dollar dominance and Yen weakness), expanded slightly. During the "employment statistics shock," the difference in the 2-year bond yields between the US and Japan shrank to below 2.9% in one go, but by the end of last week, it had expanded to nearly 3% (see Chart 2).
Source: Manex Trader FX
The plummet of the Dollar/Yen triggered by the release of the US employment statistics was referred to as the "employment statistics shock." Last week (week of August 4), this subsided slightly because the day-to-day interest rate difference between the US and Japan, which had sharply contracted due to the "employment statistics shock" (Dollar dominance and Yen weakness), expanded slightly. During the "employment statistics shock," the difference in the 2-year bond yields between the US and Japan shrank to below 2.9% in one go, but by the end of last week, it had expanded to nearly 3% (see Chart 2).
[Figure 2] USD/JPY and the Japan-U.S. 2-Year Bond Yield Spread (From April 2025)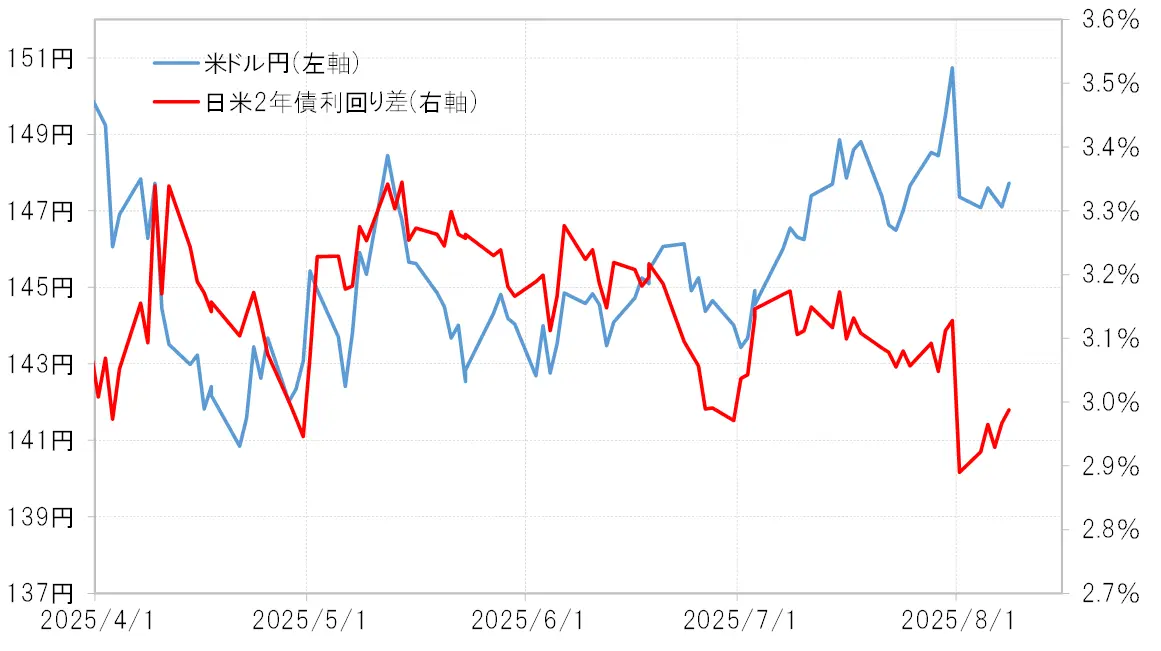 Source: Created by Monex Securities from data provided by Refinitiv.
The slight widening of the interest rate gap between Japan and the U.S. is largely due to the fact that U.S. interest rates, which had significantly declined due to the "employment statistics shock," experienced a small rebound last week (the week of August 4). This likely indicates a reaction to the "employment statistics shock."
Source: Created by Monex Securities from data provided by Refinitiv.
The slight widening of the interest rate gap between Japan and the U.S. is largely due to the fact that U.S. interest rates, which had significantly declined due to the "employment statistics shock," experienced a small rebound last week (the week of August 4). This likely indicates a reaction to the "employment statistics shock."
Incorporating early rate cuts = Background of the reluctance to lower US interest rates
The U.S. 2-year Treasury yield, which reflects U.S. monetary policy, was around 3.95% before the employment statistics were released, but it plummeted to 3.7% immediately after the announcement. As a result, it fell 0.8% below the upper target of the federal funds rate, which is 4.5% (see Chart 3).
[Figure 3] Spread between FF rate and US 2-year bond yield (2014 onwards)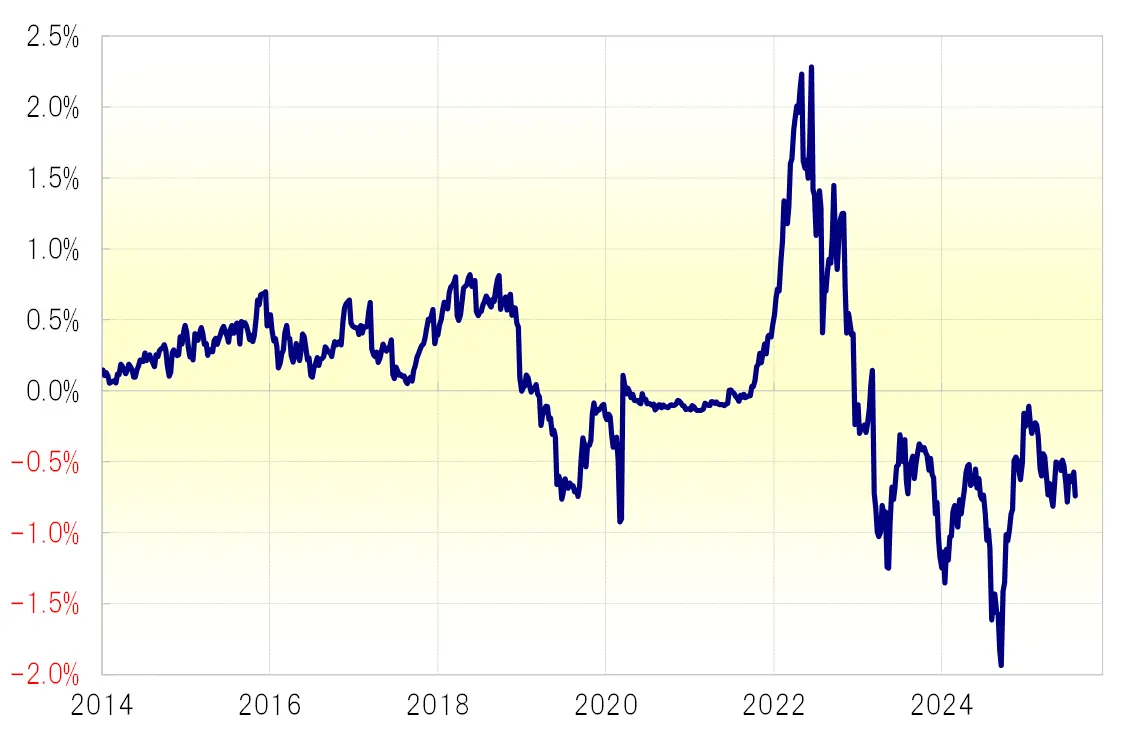 Source: Created by Monex Securities from data provided by Refinitiv.
In recent years, with the beginning of the Fed's interest rate cuts, in the case of August 2019, the US 2-year Treasury yield fell as much as about 0.8% below the upper limit of the target range for the federal funds rate before the cuts began. This time, due to the "employment report shock," the spread between the federal funds rate and the US 2-year Treasury yield has widened to a similar extent. This suggests that the market has priced in the resumption of interest rate cuts at the next September FOMC (Federal Open Market Committee) meeting in just one day. Therefore, last week (the week of August 4), such a sharp movement due to the "employment report shock" may have subsided, leading to a slight correction.
Source: Created by Monex Securities from data provided by Refinitiv.
In recent years, with the beginning of the Fed's interest rate cuts, in the case of August 2019, the US 2-year Treasury yield fell as much as about 0.8% below the upper limit of the target range for the federal funds rate before the cuts began. This time, due to the "employment report shock," the spread between the federal funds rate and the US 2-year Treasury yield has widened to a similar extent. This suggests that the market has priced in the resumption of interest rate cuts at the next September FOMC (Federal Open Market Committee) meeting in just one day. Therefore, last week (the week of August 4), such a sharp movement due to the "employment report shock" may have subsided, leading to a slight correction.
The US stocks that plummeted due to the "employment statistics shock" are rebounding = concerns over "overvaluation" remain.
Another reason for the pause in the rapid decline of U.S. interest rates is thought to be the impact of the rebound in major U.S. stock indices, which plummeted due to the "employment statistics shock" but have since updated their record highs. The "employment statistics shock" refers to the significant downward revision of past figures in the U.S. employment statistics, specifically the NFP (Non-Farm Payroll) numbers, which raised concerns about a sharp deterioration in the U.S. labor market. Amid this, U.S. stocks generally experienced a sharp decline, but last week (the week of August 4), they turned to a rebound, particularly the NASDAQ Composite Index, which quickly updated its highs from before the "employment statistics shock."
However, there are concerns that such US stocks are technically "overbought." In particular, the relative stock price of the Nasdaq Composite Index against the NY Dow has now exceeded even the peak of the IT bubble in 2000 (see Chart 4). The overvaluation of the Nasdaq Index against the NY Dow has expanded beyond that of the IT bubble phase, which should be a cause for concern as an indication of being "overbought."
[Figure 4] Relative Stock Prices of Nasdaq Composite Index / NY Dow (1990 - )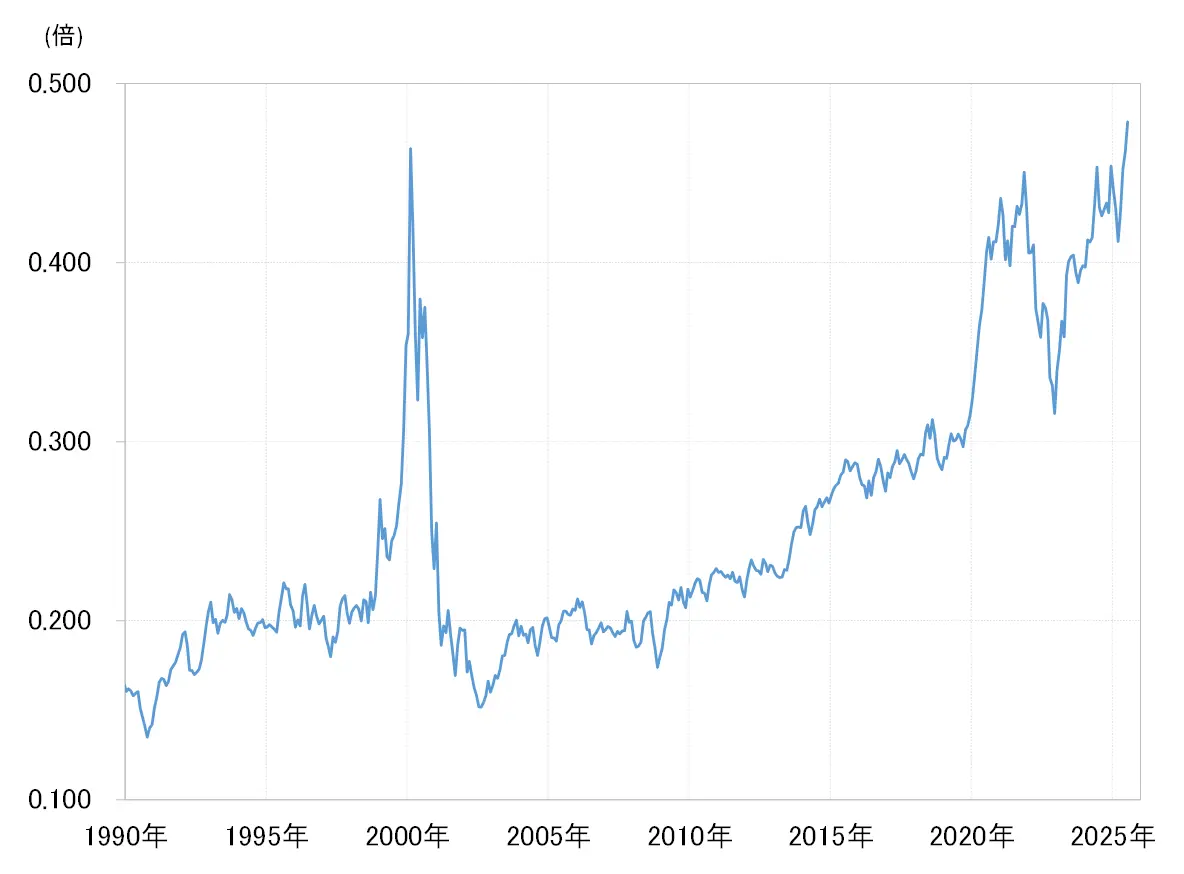 Source: Created by Monex Securities based on data from Refinitiv.
Highlights of This Week (Week of August 11) = Will the U.S. Economic Indicators Affect the Outlook for Early Rate Cuts?
CPI, PPI, and retail sales = A series of highly anticipated July U.S. economic indicators are about to be released.
This week, several important U.S. economic indicators, including the CPI (Consumer Price Index), PPI (Producer Price Index), and retail sales, are scheduled to be announced. As mentioned previously, following the "employment statistics shock," the outlook for an early resumption of U.S. interest rate cuts has strengthened, but the results of the economic indicators will determine how that unfolds, which will be the main focus this week.
Inflation indicators such as CPI and PPI are expected to have higher growth rates than last month. If this prediction holds true, there may be concerns about a resurgence of inflation, leading to a cautious stance from the Federal Reserve (FRB) regarding the resumption of interest rate cuts. Consequently, U.S. interest rates, which significantly declined due to the "employment statistics shock," may rise.
On the other hand, since the economic indicators such as retail sales, the NY Fed manufacturing index, and industrial production are generally expected to worsen compared to the previous time, if this expectation is met, it will further strengthen the view that an early resumption of rate cuts is likely.
Another point of interest is whether U.S. stocks at their all-time highs = "overbought" will continue.
From the above, it seems that depending on the results of economic indicators, U.S. interest rates could both fall and rise. Therefore, I believe another key factor is the trend of stock prices. As we have already seen, although the major U.S. stock indices plummeted due to the "employment statistics shock," they quickly turned upward last week (the week of August 4), particularly the Nasdaq Composite Index, which updated its all-time high. There is a sense of incongruity in resuming interest rate cuts while stock prices, which are a leading indicator of the economy, are hovering around their all-time highs.
What can be inferred from such stock price movements is that, from an economic perspective, the likelihood of an unnecessary resumption of interest rate cuts is increasing, while the stock prices are becoming somewhat overheated (see Chart 5). If that is the case, whether the stock prices continue to "rise too much" separate from the results of this week’s (week of August 11) economic indicators may be another point of interest as a suggestion for the Dollar/Yen through U.S. interest rates.
[Figure 5] Nasdaq Composite Index 90-day MA deviation rate (2010 - )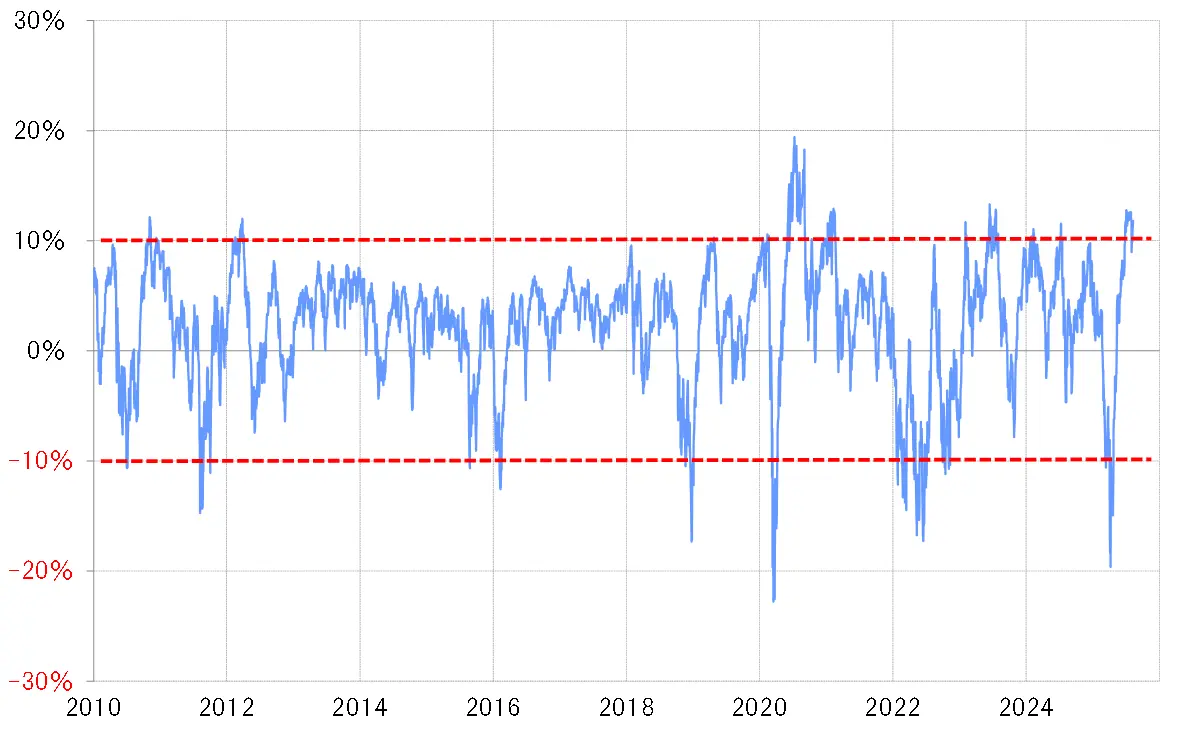 Source: Created by Monex Securities from Refinitiv data.
The forecast range for USD/JPY for the week of August 11 is 145 to 150 yen.
In considering the direction of the Dollar/Yen this week, we will pay attention to whether U.S. stocks continue to rise. If the stock market continues to rise, it will be difficult to drop below 146 yen, similar to last week (the week of August 4), and the Dollar/Yen is likely to test the rebound from the "employment statistics shock." On the other hand, if the stock market declines, the possibility of falling below 146 yen will arise. Taking this into account, I predict that the Dollar/Yen will be between 145 and 150 yen this week.